Hello,
I have been banging my head for while trying to understand why my optimization is not working properly.
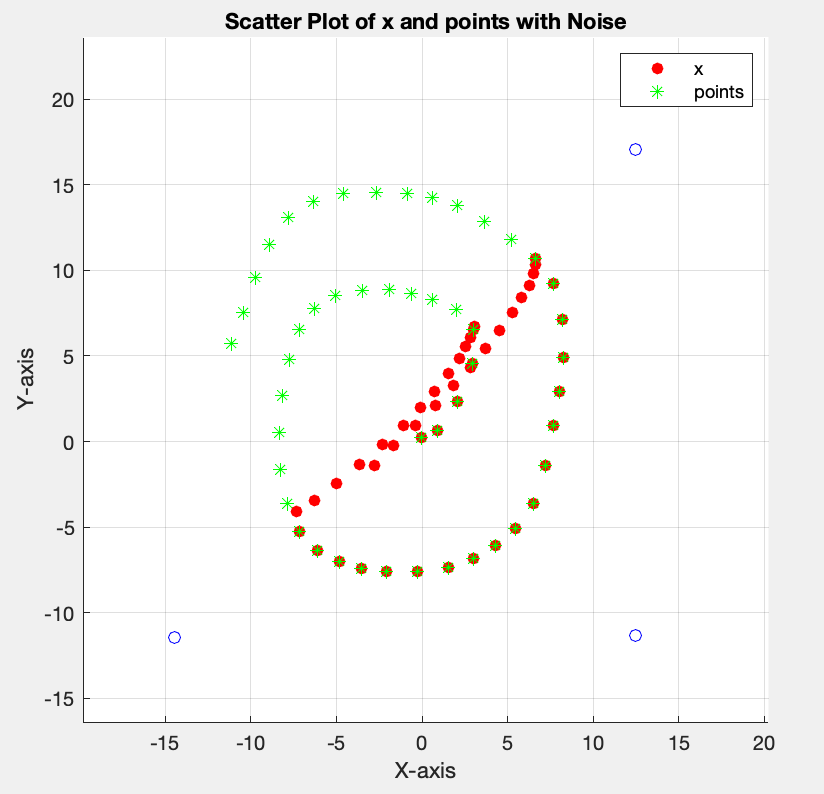
Here is the problem: there is a set of points (from a trajectory but that is not relevant). and 3 anchors.
The information that we have is the ranges seen by the 3 anchors, and the CVX will try to minimize a cost function to determine the position. The original points are plotted in green, and the red ones are the optimized points. As you can see, the program fails to find the correct points when they are outside the triangle formed by the three anchors. My professor does not understand why this is, and gets the same result. It should be able to locate every point, because we are in 2D and there are 3 anchors and 3 ranges for each point. Also, part of the cost function relates to velocities, but ignore that, that term is set to be equal to zero here anyway.
% Load data
load('trajectoryData.mat');
%%%%% Data imported from generate_trajectory_data.m :
%anchor - coordinates for the anchors
%velocities - velocities measurements at each position
%points - coordinates for the positions
%ranges - range measurements of the anchors at each position
%angles - angle measurements of the anchors at each position
%Delta - time step between positions = 1/sampling rate

% Define the row index you want to remove
to_remove = 1;  % For example, to remove the second row

% Use indexing to remove the specified row
anchor(to_remove, :) = [];
ranges(:, to_remove) = [];

% Define parameters
T = size(points, 1);  % Number of time steps
M = size(ranges, 2);  % Number of anchors
mu = 0;  % Define a specific mu value
Delta = 1;  % Assuming Delta is 1, adjust as per your data

% Introduce noise to the measurements
noise_level = 0.1;  % Define the noise level
ranges_noisy = ranges ;%+ noise_level * randn(size(ranges));
velocities_noisy = velocities + noise_level * randn(size(velocities));

% Calculate velocities
vx = diff(points(:, 1)) / Delta;
vy = diff(points(:, 2)) / Delta;
velocity = [vx, vy];

% Begin CVX optimization
cvx_begin

    variable x(T, 2)

    objective = 0;
    for t = 1:T
        % Add to the cost the measured ranges error with noise
        for k = 1:M
            difference = norm(x(t, :) - anchor(k, :)) - ranges_noisy(t,k);
            objective = objective + square_pos(difference);
        end

        % Add to the cost the measured velocity error with noise
        if t == 1
            velocities_hat = (x(t+1, :) - x(t, :)) / Delta;
        elseif t == T
            velocities_hat = (x(t, :) - x(t-1, :)) / Delta;
        else
            velocities_hat = (x(t+1, :) - x(t-1, :)) / (2*Delta);
        end
        difference = velocities_hat - velocities_noisy(t, :);
        objective = objective + mu * quad_form(difference, eye(length(difference)));
    end

    % Minimize the cost
    minimize(objective)

cvx_end

% Create a scatter plot
figure; hold on;
scatter(x(:,1), x(:,2), 'r', 'filled');   % 'r' for red color
scatter(points(:,1), points(:,2), 'g*');  % 'g' for green color
scatter(anchor(:,1), anchor(:,2), 'bo');  % 'b' for blue color

% Set the axis limits
axis([-20 20 -20 20]);
axis square; % This ensures the aspect ratio is 1:1


% Assuming 'ranges' is a matrix where each row corresponds to a point and each column to an anchor
[numPoints, numAnchors] = size(ranges);

%{
for i = 8:10
    for j = 1:numAnchors
        viscircles(anchor(j, :), ranges(i, j), 'LineWidth', 0.5, 'EdgeColor', 'c');  % 'c' for cyan color
    end
end


for i = 8:10
    for j = 1:numAnchors
        distance = sqrt((x(i, 1) - anchor(j, 1))^2 + (x(i, 2) - anchor(j, 2))^2);
        viscircles(anchor(j, :), distance, 'LineWidth', 0.5, 'EdgeColor', 'r');
    end
end
%}

xlabel('X-axis');
ylabel('Y-axis');
title('Scatter Plot of x and points with Noise');
legend('x', 'points');
grid on;

% Display the figure
hold off;

% Save the estimated positions from Task 12
save('estimated_positions_noise.mat', 'x');
Thanks